

Implementation (Action) Plan
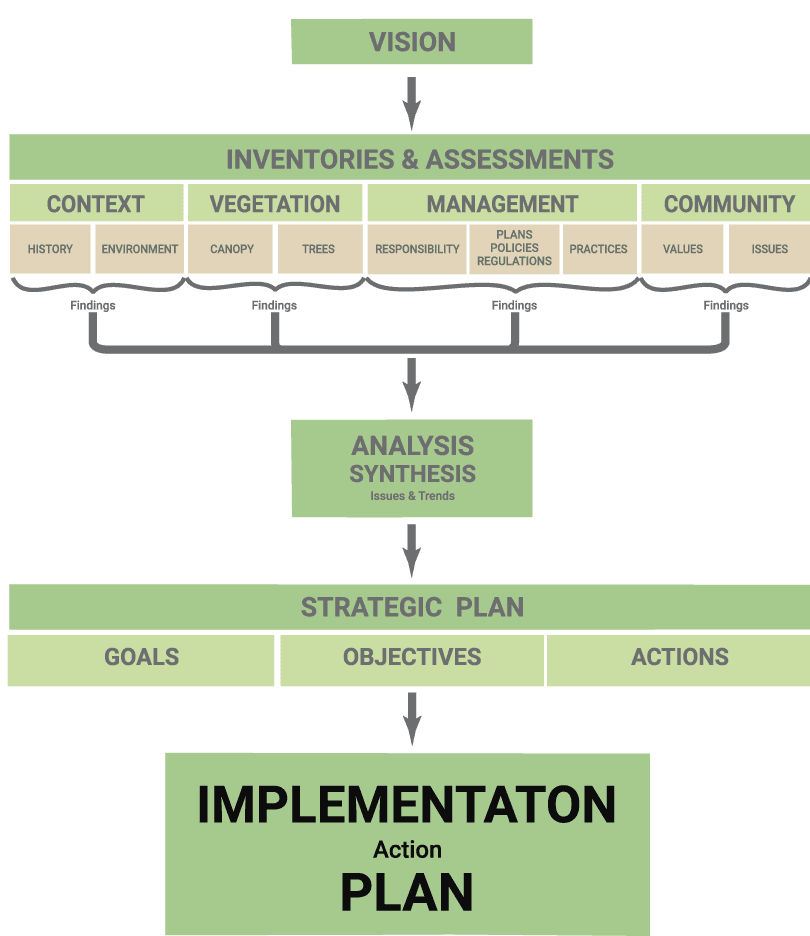
The Strategic Plan sets goals and objectives, which provide the overall destinations of the plan. It also lists actions needed to accomplish the goals and objectives. The implementation plan describes how these actions will be carried out. It is likely that the implementation plan will span shorter time blocks and will be revised based on the pace of the implementation. For each action, the implementation plan spells out:
- priority ranking
- time schedule
- personnel responsible for administering and carrying out the action
- funding sources
- specific budget on an annual or multi-year basis and funding source(s)
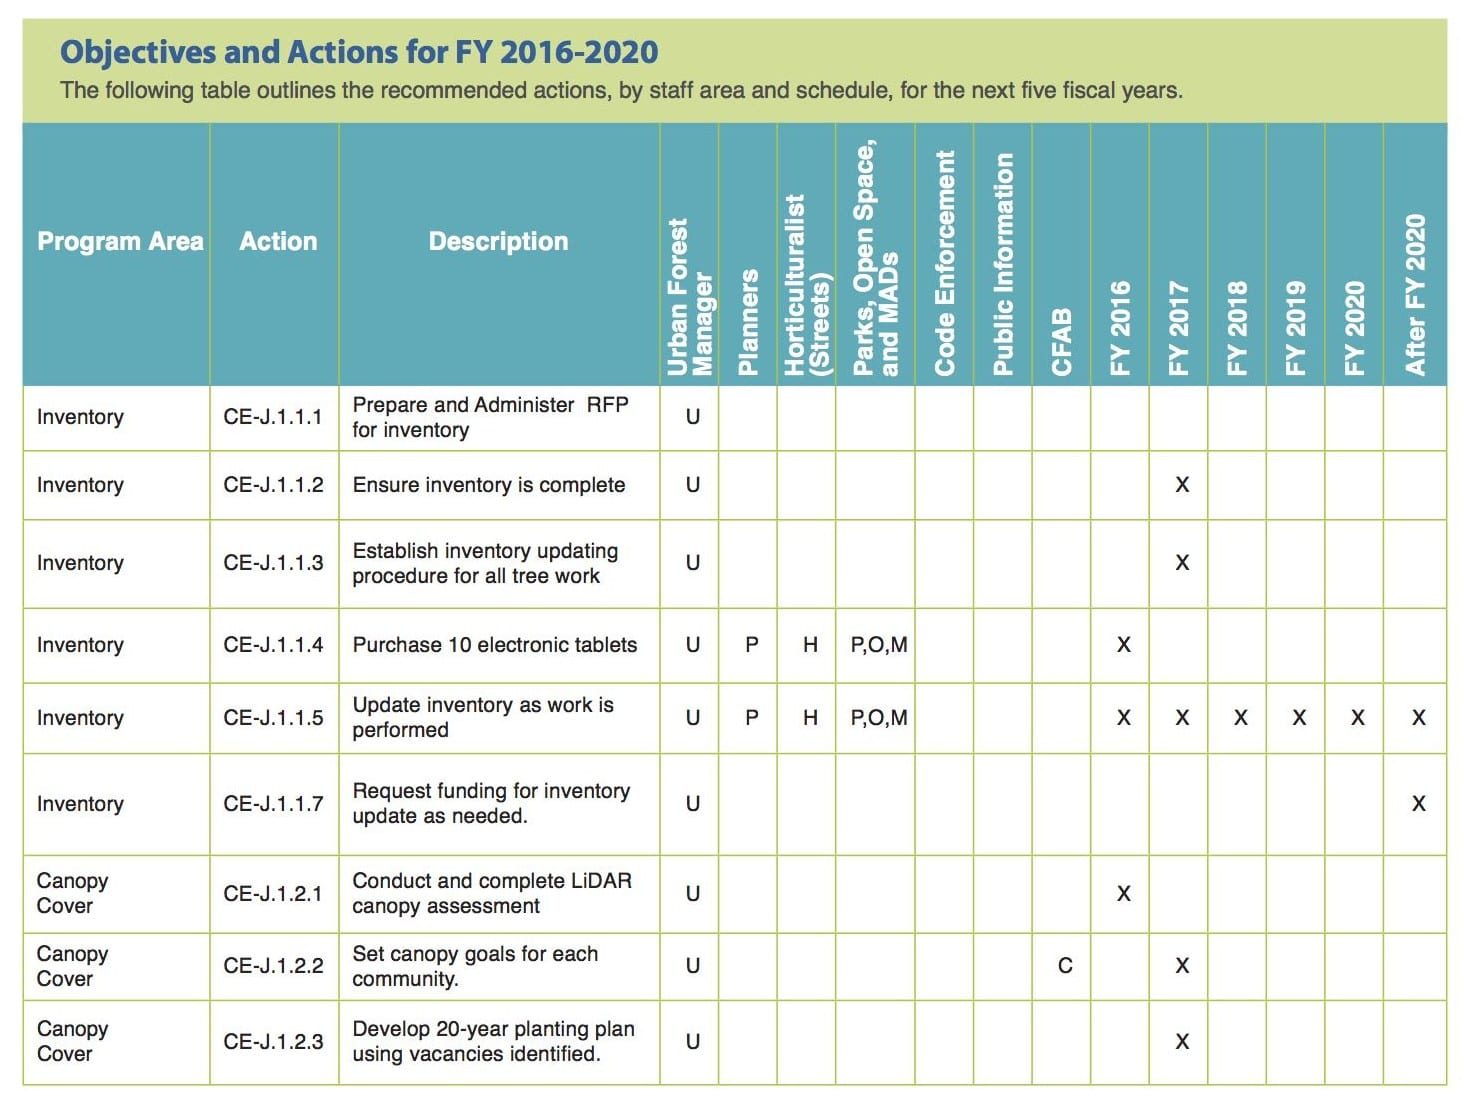
OBJECTIVE 1.1: Complete a community tree inventory: Priority 1
| Actions | Cost/Funding Source | Performed By | Status/Completion Date |
|---|---|---|---|
| 1.1.1 Determine how inventory will be conducted | N/A (volunteers) | Tree board | September 2011 |
| 1.1.2 Apply for Urban Forestry Assistance grant | N/A (volunteers) | Tree board | October 2011 |
| 1.1.3 Hire intern or consultant | $4,000 DNR Urban Forestry Assistance Grant | Tree board and staff | February 2012 |
| 1.1.4 Perform inventory | Included in $4,000 above | Intern or consultant | June 2012 |
| 1.1.5 Conduct training, as necessary | Included in $4,000 above | Intern or consultant | June 2012 |
| 1.1.6 Purchase equipment and materials, as necessary | $500 forestry budget | Tree board or staff | June 2012 |
| 1.1.7 Analyze inventory findings | Included in $4,000 grant | Intern or consultant and tree board | August 2012 |
OBJECTIVE 1.2 Prepare an inventory-based management plan: Priority 1
Review Priorities
Priority rankings are used to phase activities over time so that high priority tasks are completed before low priority tasks. Use the previously established priority rankings of goals and objectives to determine how to allocate the budget. For example, dealing with a backlog of potentially hazardous trees may be the highest priority in the first years of the plan. After the backlog has been cleared out, other actions (such as replanting after tree removals) may have the next highest priority.
Also, decide if you want to include viable actions in the implementation plan that were considered, but not selected due to lack of priority or funding.
What are the highest priority actions? Rank actions according to priority.
Which actions need to occur in a specific sequence?
Establish Time Frames and Timelines
The implementation plan should include realistic timelines for conducting actions and meeting objectives. Some activities need to be completed in a certain order. Budget and funding affect the timeline for plan activities. Following the level-of-service approach, it might be advantageous to delay or spread out implementation of lower priority actions to ensure that high priority tasks are accomplished first. Long-term urban forest management plans often have to be completed in phases. An implementation plan might span the first phase, for example one to five years. (If it only covers one year, it can be called an annual plan.) Implementation plans are regularly revised and adjusted according to factors that speed or slow progress.
Should goals, objectives, and/or actions be phased or organized by time frame, e.g. within one, five, or ten years?
As the implementation plan is developed, it might become clear that some actions actually require multiple steps to complete. If so, it is useful to specify time schedule, budget, and responsibilities for each separate step in an Implementation (Actions) Matrix.
Assign Responsibilities
The implementation plan should indicate who and which department is going to carry out the actions. For actions that require cooperation and coordination between departments, all department managers involved should agree on assigned responsibilities. Managers should also agree on the level of priority that is needed to ensure that actions can be implemented successfully. Developing and revising implementation plans usually occurs at the program level by the departments directly involved.
Funding
During your review of existing management activities, sources of existing funding will be identified. If these funds are inadequate for newly identified goals and objectives, one of your new goals will be to develop suitable sources of funding. Grant funding may be appropriate for one-time or infrequent expenses, such as developing educational handouts. Ongoing activities, such as tree care and maintaining the tree inventory, will need a stable source of funding. Some sources of funding for municipal programs include:
- Gas Tax
- Citywide assessment district
- Fines from ordinance violations
- Tree removal permit mitigation fees
- General fund
- Grants
- Community groups
- Corporate/local business sponsorships
- Partnerships with utilities
Dedicated funding is typically more reliable than funding from common sources such as the general fund.
Have you investigated all possible sources of funding for the plan? Determine funding sources/levels for action items.
Budget Development
The implementation plan budgets are needed to help develop annual work plans. Based on available funds, you might be able to accelerate or defer specific management activities called for in the plan. You can develop a level-of-service matrix to show service levels (from minimum to optimum) for each program activity area and their associated costs. This enables decision makers to understand how funding levels will affect program outputs.
How will we develop and present the budget?
Upon which scenario or scenarios (varying levels of service) should the budget be based?
Example Budget Projections
The worksheet below, which is adapted from the one presented in A technical guide to developing urban forestry strategic plans and urban forest management plans by the Wisconsin Department of Natural Resources, can be used to estimate budget figures for tree care.
| YEAR 1 | YEAR 2 | YEAR 3 | YEAR 4 | YEAR 5 | 5 YEAR TOTAL | ||||||||
|---|---|---|---|---|---|---|---|---|---|---|---|---|---|
| Activity | Diameter Class | Cost/ Tree | # of Trees | Total Cost | # of Trees | Total Cost | # of Trees | Total Cost | # of Trees | Total Cost | # of Trees | Total Cost | |
| 1-6” | |||||||||||||
| 7-12” | |||||||||||||
| 13-18” | |||||||||||||
| 19-24” | |||||||||||||
| 25-30” | |||||||||||||
| 31-36” | |||||||||||||
| Over 36” | |||||||||||||
| Activity Totals | |||||||||||||
| YEAR 1 | YEAR 2 | YEAR 3 | YEAR 4 | YEAR 5 | 5 YEAR TOTAL | ||||||||
|---|---|---|---|---|---|---|---|---|---|---|---|---|---|
| Activity | Diameter Class | Cost/ Tree | # of Trees | Total Cost | # of Trees | Total Cost | # of Trees | Total Cost | # of Trees | Total Cost | # of Trees | Total Cost | |
| Tree Removals | 1-6” | ||||||||||||
| 7-12” | |||||||||||||
| 13-18” | |||||||||||||
| 19-24” | |||||||||||||
| 25-30” | |||||||||||||
| 31-36” | |||||||||||||
| Over 36” | |||||||||||||
| Activity Totals | |||||||||||||
| Stump Removals | 1-6” | ||||||||||||
| 7-12” | |||||||||||||
| 13-18” | |||||||||||||
| 19-24” | |||||||||||||
| 25-30” | |||||||||||||
| 31-36” | |||||||||||||
| Over 36” | |||||||||||||
| Activity Totals | |||||||||||||
| Intermediate Priority Pruning | 1-6” | ||||||||||||
| 7-12” | |||||||||||||
| 13-18” | |||||||||||||
| 19-24” | |||||||||||||
| 25-30” | |||||||||||||
| 31-36” | |||||||||||||
| Over 36” | |||||||||||||
| Activity Totals | |||||||||||||
| High Priority Pruning | 1-6” | ||||||||||||
| 7-12” | |||||||||||||
| 13-18” | |||||||||||||
| 19-24” | |||||||||||||
| 25-30” | |||||||||||||
| 31-36” | |||||||||||||
| Over 36” | |||||||||||||
| Activity Totals | |||||||||||||
| Routine Pruning | 1-6” | ||||||||||||
| 7-12” | |||||||||||||
| 13-18” | |||||||||||||
| 19-24” | |||||||||||||
| 25-30” | |||||||||||||
| 31-36” | |||||||||||||
| Over 36” | |||||||||||||
| Activity Totals | |||||||||||||
| Tree Planting | Site Prep | ||||||||||||
| Tree Purchase | |||||||||||||
| Planting | |||||||||||||
| Activity Totals | |||||||||||||
| Young Tree Care | Structural Pruning | ||||||||||||
| Mulching | |||||||||||||
| Watering | |||||||||||||
| Activity Totals | |||||||||||||
| Totals Per Year | |||||||||||||
Activities in the worksheet budgeted by diameter class include:
- Tree removal
- Stump removal
- Immediate priority pruning
- High priority pruning
- Routine pruning
Based on your own experience, you may decide to use different diameter classes or other factors to develop individual cost categories. Overall averages per tree may also be used if you do not track costs by tree category. You can also check with other organizations or communities to get per tree cost estimates if you lack this information.
The spreadsheet from Wisconsin DNR also includes other tree care activities that are not categorized by tree diameter class. Some of these activities may vary according to other categories that you may want to include (e.g., planting site prep may differ based on site characteristics).
| YEAR 1 | YEAR 2 | YEAR 3 | YEAR 4 | YEAR 5 | 5 YEAR TOTAL | ||||||||
|---|---|---|---|---|---|---|---|---|---|---|---|---|---|
| Activity | Sub Activity | Cost/Tree | # of Trees | Total Cost | # of Trees | Total Cost | # of Trees | Total Cost | # of Trees | Total Cost | # of Trees | Total Cost | |
| Tree Planting | Site Prep | ||||||||||||
| Tree Purchase | |||||||||||||
| Planting | |||||||||||||
| Activity Totals | |||||||||||||
| New Tree Maintenance | Training / Pruning | ||||||||||||
| Mulching | |||||||||||||
| Watering | |||||||||||||
| Other Maintenance | |||||||||||||
| Activity Totals | |||||||||||||
| Grand Totals Per Year | |||||||||||||
Level of Service Matrix
Based on available funds, you may need to accelerate or postpone actions called for in the plan. If you develop a level-of-service matrix, it can help decision makers see how funding levels could affect program outputs (from minimum to optimum). Using a level-of-service approach, you might choose to delay the completion of lower priority actions to ensure that higher priority tasks are accomplished first.
Broad urban forest program level of service budget projections
Another example of budgeting is found in the Davis Community Tree Management Plan developed in 2002. This plan used a level of service (LOS) matrix. Level of service methodology has been applied in various areas of planning, including traffic planning and emergency response. A LOS matrix is developed by selecting specific scenarios that address plan goals to varying degrees and determining the cost associated with each scenario. The LOS matrix provides a way to show the costs and benefits associated with different levels of management inputs.
The Davis plan explains how each level of service was determined. Levels of service were based on the City of Davis’s existing urban tree program and best practice recommendations for tree care from various sources. Budget figures are from their calculated expenditures. The table includes both the current LOS and the staff’s recommended LOS for the plan.
A sample survey conducted in Davis showed a backlog of potentially hazardous trees in the street tree inventory. Removing hazardous trees was given the highest program priority in the plan.
| PROGRAM AREA | LEVEL OF SERVICE | BUDGET IMPACT |
|---|---|---|
| Hazard Tree Abatement | ||
| Potential level of service 1 (minimal) | On request only (City removes 125 trees / yr) | $34,375 / yr ($275 / tree) |
| Potential level of service 2 | Remove on request (125 / yr) and eliminate backlog of trees in 10 yrs (25 trees / yr) | $41,250 /yr for 10 yrs ($275 / tree) |
| Potential level of service 3 | Remove on request (125 / yr) and eliminate backlog in 5 yrs (50 trees / yr) total 175 /yr @ $275 / tree) | $48,125 / yr for 5 yrs, then $34,375 /yr |
| Potential level of service 4 | Remove on request (125 / yr) and eliminate backlog in 1 yr (250 trees / yr @ $275 /tree) | $34,375 / yr for five years, and one-time capital expenditure of $68,750 to remove 250 trees |
| Current (2000) level of service in FY’01 | Level of Service: 1 (125 / yr by City at $252 / tree) | $31,500 |
| Staff/Tree Commission Recommendation for Fiscal Year | Level of Service 4: (125 / yr by City at $275 / tree and onetime removal of 250 trees to eliminate backlog) | $34,375 / yr for five years, and one-time capital expenditure of $68,750 to remove 250 trees |
| Mature Tree Care | ||
| Potential level of service
1 (minimal) |
City prunes 1,500 trees / yr (16-yr cycle) | $195,000 / yr ($130/tree) |
| Potential level of service 2 | City prunes 1,500 / yr and contractor prunes 750 / yr (10-yr cycle, 2,250 trees/yr) | $270,000 / yr, City = $195,000 ($130/tree), contractor = $75,000 ($100/tree) |
| Potential level of service 3 | City prunes 1,500 / yr and contractor prunes 1,425 / yr (8-yr cycle, 2,925 trees / yr) | $337,500 / yr, City = $195,000 ($130/tree), contractor = $142,500 ($100/tree |
| Potential level of service 4 | (4,680 trees / yr), City prunes 1,500 / yr and contractor prunes 3,180 / yr | $513,000 /yr, City = $195,000 ($130/tree), contractor = $318,000 ($100/tree) |
| Current (2000) level of service in FY’01 | 3
(8-yr cycle, 2,971 / yr at $94 / tree) |
$278,500, City = $178,500, Contractor = $100,000 |
| Staff/Tree Commission Recommendation for Fiscal Year | 3: (8- yr cycle, 2,925 / yr) | $337,500, City = $195,000, Contractor = $142,500 |
| Young Tree Care | ||
| Potential level of service 1 (minimal) | No young tree care | $0 |
| Potential level of service 2 | Only TREE Davis prunes (13-yr cycle, 350 trees / yr @ $20/tree) | $7,000 / yr |
| Potential level of service 3 | Only TreeDavis prunes at 50% of goal (4-yr cycle, 2,383 trees / yr @ $20/tree) | $47,660 / yr |
| Potential level of service 4 | TREE Davis prunes 2,766 / yr and City prunes 2,000 / yr (2-yr cycle, 4,766 / yr) | $125,320 for 5 yrs, City = $70,000 ($35/tree), TREE Davis = $55,320 ($20/tree) |
| Current (2000) level of service in FY’01 | 3
(4.5-yr cycle, 2,050 / yr by City and TREE Davis at $31 / tree |
$64,000, City = $54,000, TREE Davis = $10,000 |
| Staff/Tree Commission Recommendation for Fiscal Year | Level of Service 4: (2- yr cycle, 4,766/yr,
2,766 / yr by TREE Davis at $20 / tree, 2,000 by City at $35 / tree) |
$125,320 for 5 yrs, City = $70,000 ($35/tree), TREE Davis = $55,320 ($20/tree) |
| Planting | ||
| Potential level of service 1 (minimal) | No new city funded tree planting | $0 |
| Potential level of service 2 | Replace removals only (125 trees / yr) | $6,250 / yr (TREE Davis @ $50/tree) |
| Potential level of service 3 | Replace removals, plant on request, and achieve > 90% full stocking in 10 years (375 trees / yr) | $18,750 for 10 yrs (TREE Davis @ $50/tree) |
| Potential level of service 4 | Replace removals, plant on request, and achieve > 90% full stocking in 5 years (625 trees / yr) | $39,050 for 5 yrs, City = $23,400 ($75/tree), TREE Davis = $15,650 ($50/tree) |
| Current (2000) level of service in FY’01 | 4 (480 / yr by City at $75 / tree) | $36,000 |
| Staff/Tree Commission Recommendation for Fiscal Year | Level of Service 2: Replace removals (125 / yr by TREE Davis at $50 / tree) and one-time funds to re-plant 250 removed trees. | $6,250 for five years, and onetime capital expenditure of $12,500 to re-plant removed trees. |
| Administration | ||
| Potential level of service 1 (minimal) | 0.67 Supervisory Arborist / 20,000 trees, $2.50 / tree | $81,824 |
| Potential level of service 2 | 0.83 Supervisory Arborist / 20,000 trees, $3.13 / tree | Budget Impact: $94,696 |
| Potential level of service 3 | 1 Supervisory Arborist / 20,000 trees, $3.75 / tree | / 20,000 trees, $3.75 / tree Budget Impact: $117,673 |
| Potential level of service 4 | 1.17 Supervisory Arborist / 20,000 trees, $4.37 / tree | $143,246 |
| Current (2000) level of service in FY’01 | Level of Service: 3 (1 FTE supervisory arborist for 20,000 public trees, $3.75 / tree) | $112,500 |
| Staff/Tree Commission Recommendation for Fiscal Year | Level of Service 3: (1 FTE supervisory arborist for 20,000 public trees, $3.75 / tree) | $117,673 |
| Total budget impact | ||
| Potential level of service 1 (minimal) | City = $311,199 | |
| Potential level of service 2 | $ 419,196 (City = $330,946, TREE Davis = $13,250, Contractor = $75,000) | |
| Potential level of service 3 | $ 569,708 (City = $360,798, TREE Davis = $66,410, Contractor = $142,500) | |
| Potential level of service 4 | $854,991 (City = $466,021, TREE Davis = $70,970, contractor = $318,000, plus onetime capital expenditure by City of $68,750) | |
| Current (2000) level of service in FY’01 | $522,500 (City = $412,500, TREE Davis = $10,000, Contractor = $110,000) | |
| Staff/Tree Commission Recommendation for Fiscal Year | $621,118 (City = $417,048, TREE Davis = $61,570, Contractor = $142,500, Capital Exp: City = $68,750, TREE Davis = $12,500) | |
| Action | Description | By Whom | Target Date | Actual Completion |
|---|---|---|---|---|
| 1.1.1 | Secure canopy cover data | Management staff | Jan 2015 | |
| 1.1.2 | Review data every five years | Management staff | Every 5 yrs | |
| 1.1.3 | Develop policy to encourage planting in front yards | Management staff | Jan 2016 | |
| 1.2.1 | Establish canopy cover goals | Management staff | June 2015 | |
| 1.3.1 | Identify potential planting sites by grid | Tree Section Supervisor | Jan 2016 | |
| 1.3.2 | Align tree planting program with canopy goals | Tree Section Supervisor | Dec 2016 | |
| 1.3.3 | Budget and implement planting program | Tree Section Supervisor | Yearly | |
| 1.4.1 | Calculate number of trees to be planted per year to reach canopy cover goal | Tree Section Supervisor | March 2017 | |
| 1.5.1 | Calculate costs per year for tree plantings | Tree Section Supervisor | March 2017 | |
| 1.5.2 | Enlist community groups to assist with urban forestry | Tree Section Supervisor | Sept 2017 | |
| 2.1.1 | Write specifications | Tree Section Supervisor | Feb 2015 | |
| 2.1.2 | Provide staff with stds and BMPs and require adherence | Tree Section Supervisor | Spring 2015 |
0 Comments